10.0 Chapter Prerequisites — Conic Sections
The material in this section provides a basic review of and practice problems for pre-calculus skills essential to your success in Calculus. You should take time to review this section and work the suggested problems (checking your answers against those in the back of the book). Since this content is a pre-requisite for Calculus, reviewing and mastering these skills are considered your responsibility. This means that minimal, and in some cases no, class time will be devoted to this section. When you identify areas that you need help with we strongly urge you to seek assistance outside of class from your instructor or other student tutoring service.
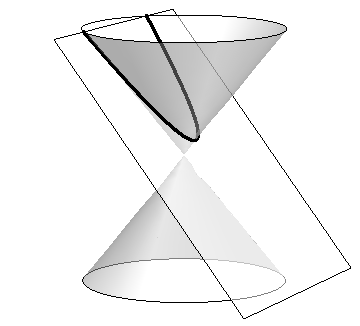
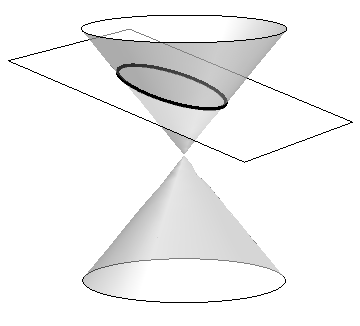
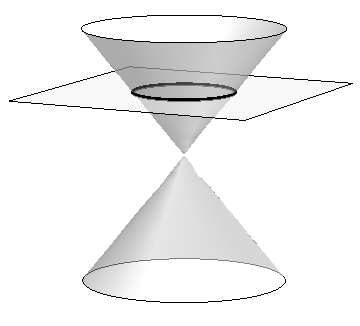
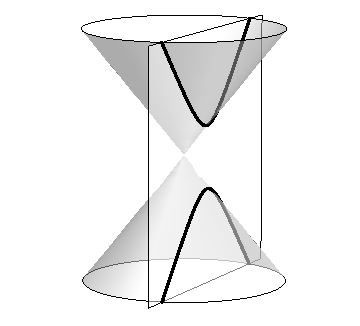
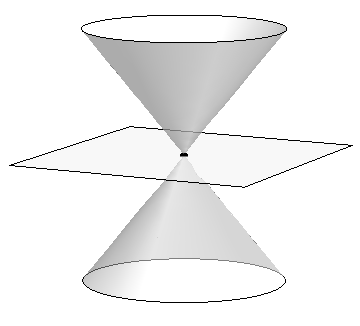
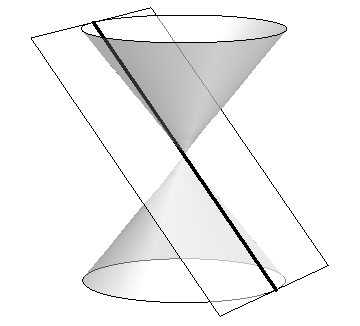
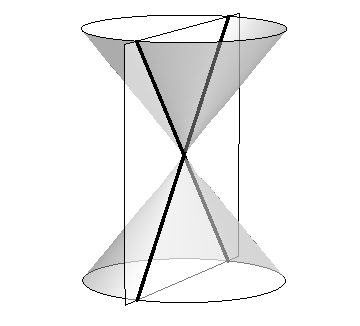
The ancient Greeks recognized that interesting shapes can be formed by intersecting a plane with a double napped cone (i.e., two identical cones placed tip-to-tip as shown in the following figures). As these shapes are formed as sections of conics, they have earned the official name “conic sections.”
The three “most interesting” conic sections are given in the top row of Figure 10.0.1. They are the parabola, the ellipse (which includes circles) and the hyperbola. In each of these cases, the plane does not intersect the tips of the cones (usually taken to be the origin).
 |
 |
 |
 |
| Parabola | Ellipse | Circle | Hyperbola |
 |
 |
 |
|
| Point | Line | Crossed Lines |
When the plane does contain the origin, three degenerate cones can be formed as shown the bottom row of Figure 10.0.1: a point, a line, and crossed lines. We focus here on the nondegenerate cases.
While the above geometric constructs define the conics in an intuitive, visual way, these constructs are not very helpful when trying to analyze the shapes algebraically or consider them as the graph of a function. It can be shown that all conics can be defined by the general second-degree equation
While this algebraic definition has its uses, most find another geometric perspective of the conics more beneficial.
Each nondegenerate conic can be defined as the locus, or set, of points that satisfy a certain distance property. These distance properties can be used to generate an algebraic formula, allowing us to study each conic as the graph of a function.
Parabolas
Definition 10.0.1 Parabola
A parabola is the locus of all points equidistant from a point (called a focus) and a line (called the directrix) that does not contain the focus.
Figure 10.0.2 illustrates this definition. The point halfway between the focus and the directrix is the vertex. The line through the focus, perpendicular to the directrix, is the axis of symmetry, as the portion of the parabola on one side of this line is the mirror-image of the portion on the opposite side.
The geometric definition of the parabola and distance formula can be used to derive the quadratic function whose graph is a parabola with vertex at the origin.
Applying transformations of functions we get the following standard form of the parabola.
Key Idea 10.0.1 General Equation of a Parabola
1.
Vertical Axis of Symmetry: The equation of the parabola with vertex at , directrix , and focus at in standard form is
2.
Horizontal Axis of Symmetry: The equation of the parabola with vertex at , directrix , and focus at in standard form is
Note: is not necessarily a positive number.
Example 10.0.1 Finding the equation of a parabola
Give the equation of the parabola with focus at and directrix at .
Solution††margin: Figure 10.0.3: The parabola described in Example 10.0.1. The vertex is located halfway between the focus and directrix, so . This gives . Using Key Idea 10.0.1 we have the equation of the parabola as
The parabola is sketched in Figure 10.0.3.
Ellipses
Definition 10.0.2 Ellipse
An ellipse is the locus of all points whose sum of distances from two fixed points, each a focus of the ellipse, is constant.
An easy way to visualize this construction of an ellipse is to pin both ends of a string to a board. The pins become the foci. Holding a pencil tight against the string places the pencil on the ellipse; the sum of distances from the pencil to the pins is constant: the length of the string. See Figure 10.0.4.
We can again find an algebraic equation for an ellipse using this geometric definition.
As shown in Figure 10.0.5, the values of and have meaning. In general, the two foci of an ellipse lie on the major axis of the ellipse, and the midpoint of the segment joining the two foci is the center. The major axis intersects the ellipse at two points, each of which is a vertex. The line segment through the center and perpendicular to the major axis is the minor axis. The “constant sum of distances” that defines the ellipse is the length of the major axis, i.e., .
Allowing for the shifting of the ellipse gives the following standard equations.
Key Idea 10.0.2 Standard Equation of the Ellipse
The equation of an ellipse centered at with major axis of length and minor axis of length in standard form is:
-
1.
Horizontal major axis:
-
2.
Vertical major axis:
The foci lie along the major axis, units from the center, where .
Example 10.0.2 Finding the equation of an ellipse
Find the general equation of the ellipse graphed in Figure 10.0.6. ††margin: Figure 10.0.6: The ellipse used in Example 10.0.2.
SolutionThe center is located at . The distance from the center to a vertex is 5 units, hence . The minor axis seems to have length 4, so . Thus the equation of the ellipse is
Example 10.0.3 Graphing an ellipse
Graph the ellipse defined by .
SolutionIt is simple to graph an ellipse once it is in standard form. In order to put the given equation in standard form, we must complete the square with both the and terms. We first rewrite the equation by regrouping:
Now we complete the squares.
We see the center of the ellipse is at . We have and ; the major axis is horizontal, so the vertices are located at and . We find The foci are located along the major axis, approximately units from the center, at . This is all graphed in Figure 10.0.7.
Hyperbolas
The definition of a hyperbola is very similar to the definition of an ellipse; we essentially just change the word “sum” to “difference.”
Definition 10.0.3 Hyperbola
A hyperbola is the locus of all points where the absolute value of the difference of distances from two fixed points, each a focus of the hyperbola, is constant.
We do not have a convenient way of visualizing the construction of a hyperbola as we did for the ellipse. The geometric definition does allow us to find an algebraic expression that describes it. It will be useful to define some terms first.
The two foci lie on the transverse axis of the hyperbola; the midpoint of the line segment joining the foci is the center of the hyperbola. The transverse axis intersects the hyperbola at two points, each a vertex of the hyperbola. The line through the center and perpendicular to the transverse axis is the conjugate axis. This is illustrated in Figure 10.0.8. It is easy to show that the constant difference of distances used in the definition of the hyperbola is the distance between the vertices, i.e., .
Key Idea 10.0.3 Standard Equation of a Hyperbola
The equation of a hyperbola centered at in standard form is:
-
1.
Horizontal Transverse Axis:
-
2.
Vertical Transverse Axis:
The vertices are located units from the center and the foci are located units from the center, where .
Graphing Hyperbolas
††margin: Figure 10.0.9: Graphing the hyperbola along with its asymptotes, .Consider the hyperbola . Solving for , we find . As grows large, the “” part of the equation for becomes less significant and . That is, as gets large, the graph of the hyperbola looks very much like the lines . These lines are asymptotes of the hyperbola, as shown in Figure 10.0.9.
This is a valuable tool in sketching. Given the equation of a hyperbola in general form, draw a rectangle centered at with sides of length parallel to the transverse axis and sides of length parallel to the conjugate axis. (See Figure 10.0.10 for an example with a horizontal transverse axis.) The diagonals of the rectangle lie on the asymptotes.
These lines pass through . When the transverse axis is horizontal, the slopes are ; when the transverse axis is vertical, their slopes are . This gives equations:
| Horizontal | Vertical |
| Transverse Axis | Transverse Axis |
Example 10.0.4 Graphing a hyperbola
Sketch the hyperbola given by . ††margin: Figure 10.0.11: Graphing the hyperbola in Example 10.0.4.
SolutionThe hyperbola is centered at ; and . In Figure 10.0.11 we draw the prescribed rectangle centered at along with the asymptotes defined by its diagonals. The hyperbola has a vertical transverse axis, so the vertices are located at and . This is enough to make a good sketch.
We also find the location of the foci: as , we have . Thus the foci are located at as shown in the figure.
Example 10.0.5 Graphing a hyperbola
Sketch the hyperbola given by .
SolutionWe must complete the square to put the equation in general form. (We recognize this as a hyperbola since it is a general quadratic equation and the and terms have opposite signs.)
We see the hyperbola is centered at , with a horizontal transverse axis, where and . The appropriate rectangle is sketched in Figure 10.0.12 along with the asymptotes of the hyperbola. The vertices are located at . We have , so the foci are located at as shown in Figure 10.0.12.
This chapter explores curves in the plane, in particular curves that cannot be described by functions of the form . In this section, we learned of ellipses and hyperbolas that are defined implicitly, not explicitly. In the following sections, we will learn completely new ways of describing curves in the plane, using parametric equations and polar coordinates, then study these curves using calculus techniques.
Exercises
Problems
In Exercises 1–8, find the equation of the parabola defined by the given information. Sketch the parabola.
-
1.
Focus: ; directrix:
-
2.
Focus: ; directrix:
-
3.
Focus: ; directrix:
-
4.
Focus: ; directrix:
-
5.
Focus: ; vertex:
-
6.
Focus: ; vertex:
-
7.
Vertex: ; directrix:
-
8.
Vertex: ; directrix:
In Exercises 9–10, sketch the ellipse defined by the given equation. Label the center, foci and vertices.
-
9.
-
10.
In Exercises 11–12, find the equation of the ellipse shown in the graph.
-
11.
-
12.
In Exercises 13–16, write the equation of the given ellipse in standard form.
-
13.
-
14.
-
15.
-
16.
In Exercises 17–20, find the equation of the hyperbola shown in the graph.
-
17.
-
18.
-
19.
-
20.
In Exercises 21–22, sketch the hyperbola defined by the given equation. Label the center.
-
21.
-
22.
In Exercises 23–26, write the equation of the hyperbola in standard form.
-
23.
-
24.
-
25.
-
26.
